The Outcome
After reviewing the provided datasets, Square V ran an internal creative workshop, aimed at helping us figure out how we could "make it cool". Coming out of the workshop we had a number of ideas for design directions, interactivity concepts and also interesting features that would allow us to compare the data in different ways.
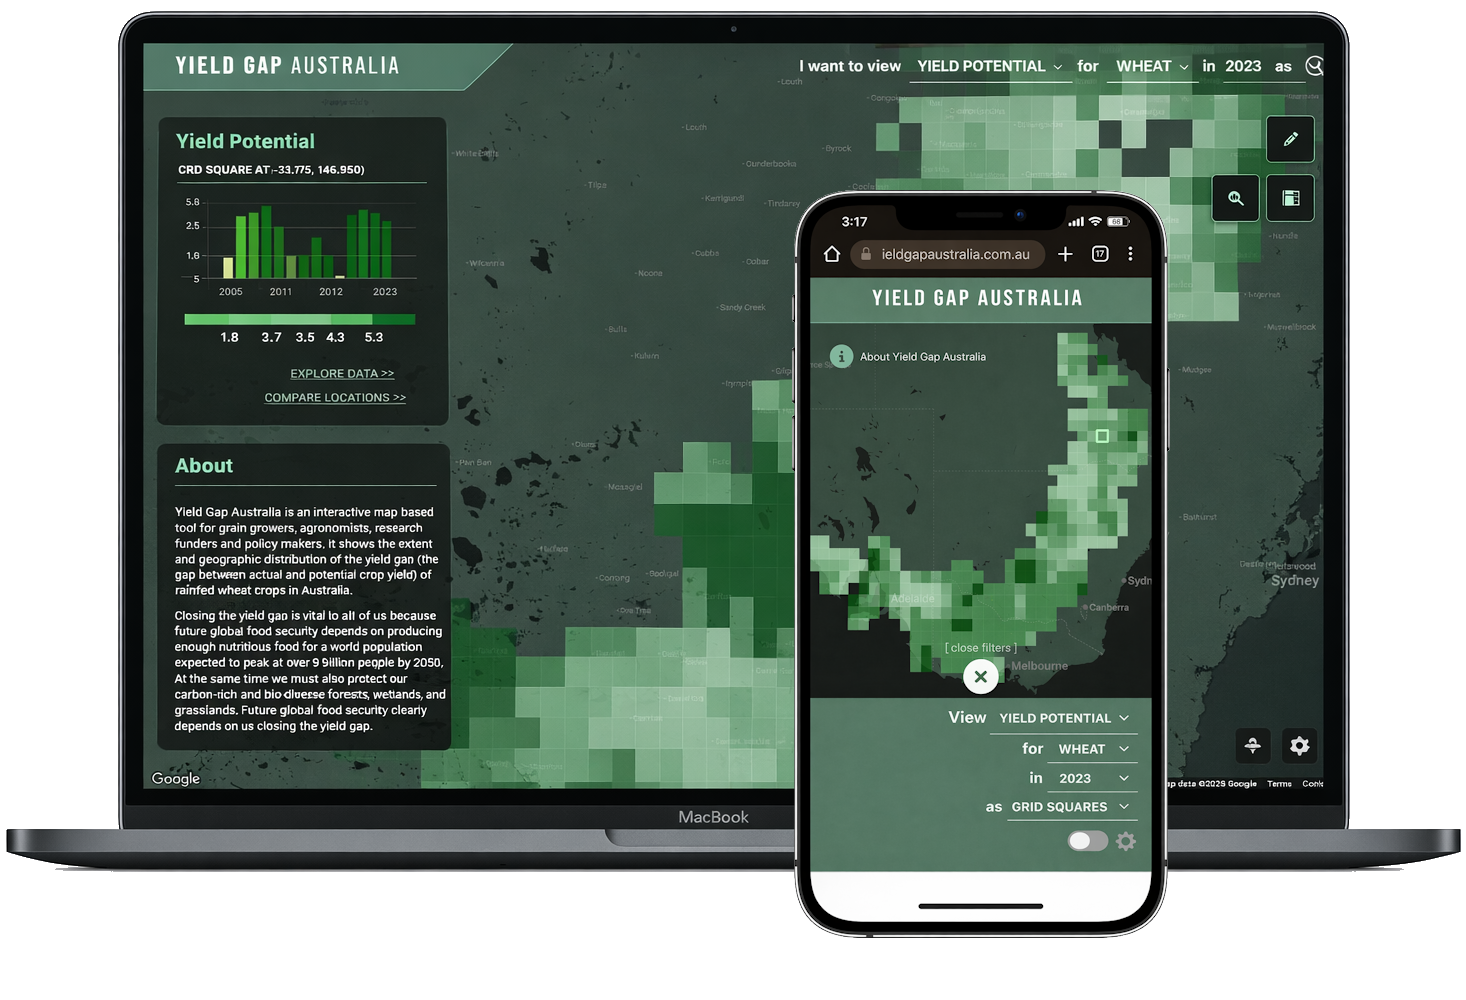
We created a wireframe prototype and workshopped this with the CSIRO team until everyone was happy with the planned concept. We then started building the new website. The new version of Yield Gap Australia is a fully client-side rendering application written in React + Redux with Python data processing integrated into the build process. The dataset structure is based on a multi-level (zoom) split of the map grid, using JSON files instead of a database (similar to Redis). Of particular note is the speed of the site considering the amount of data being rendered - we're very proud of the zippy end product that required some very clever engineering.
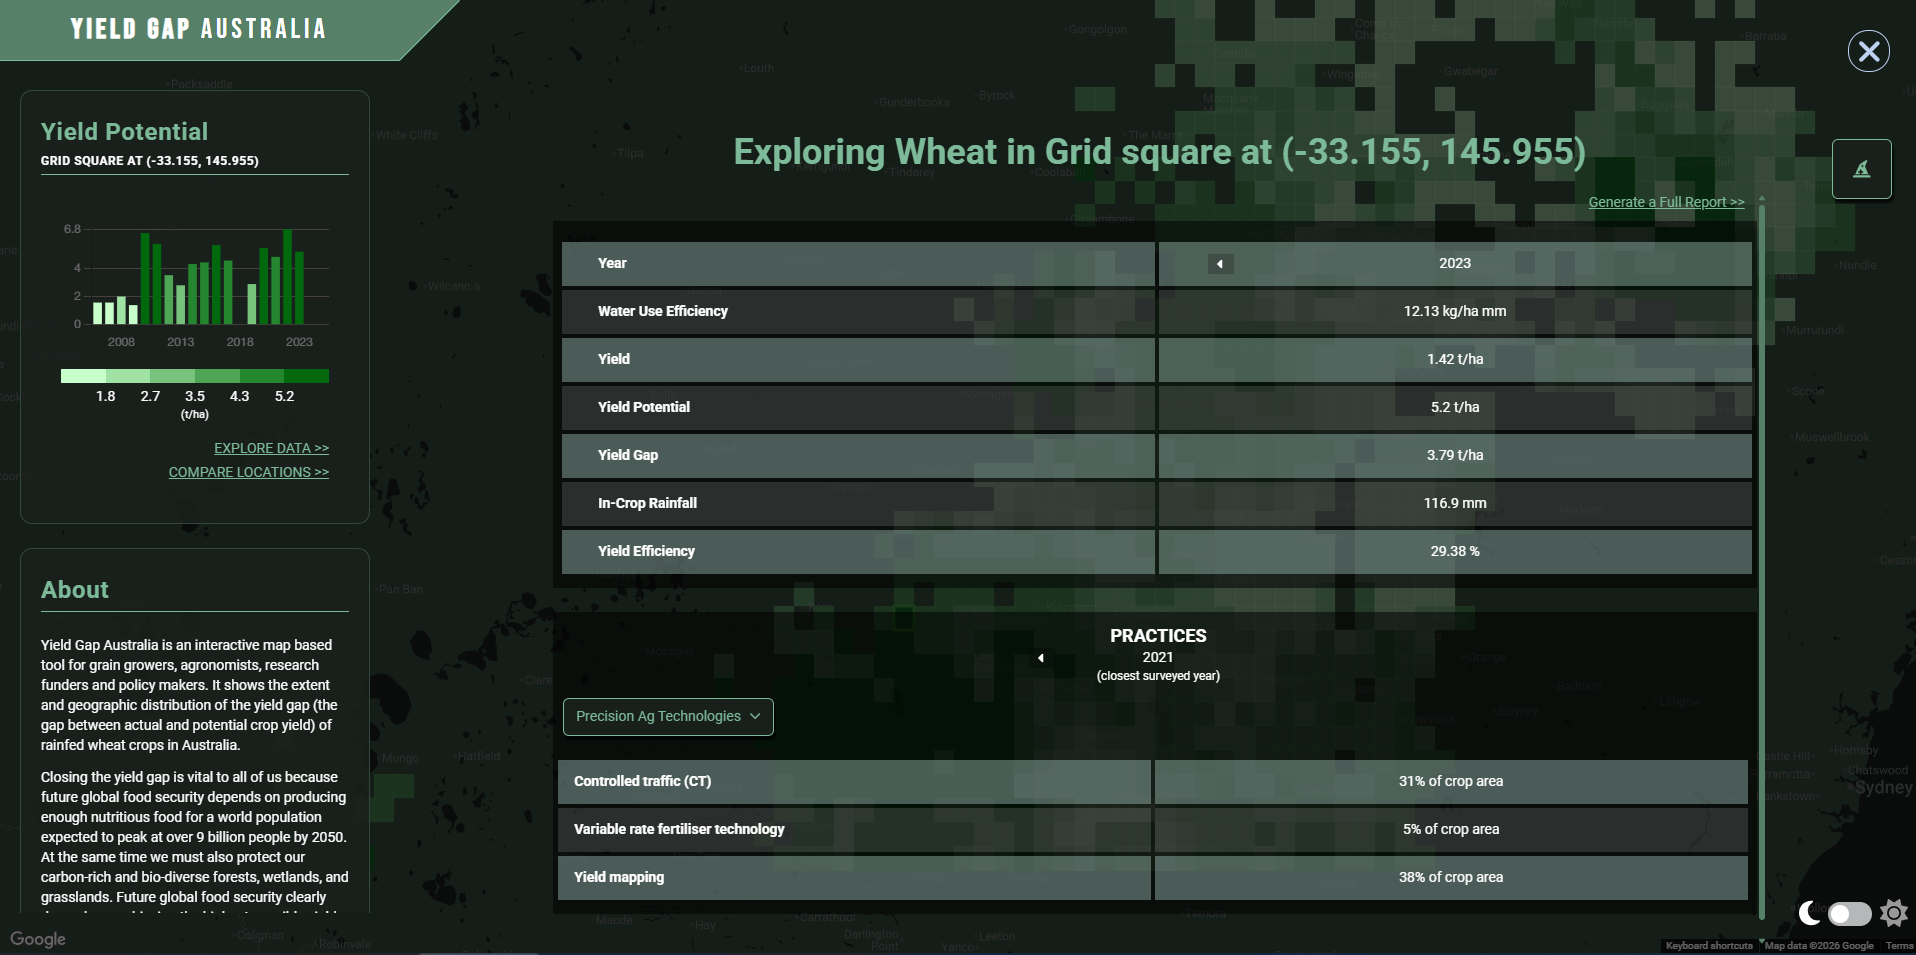
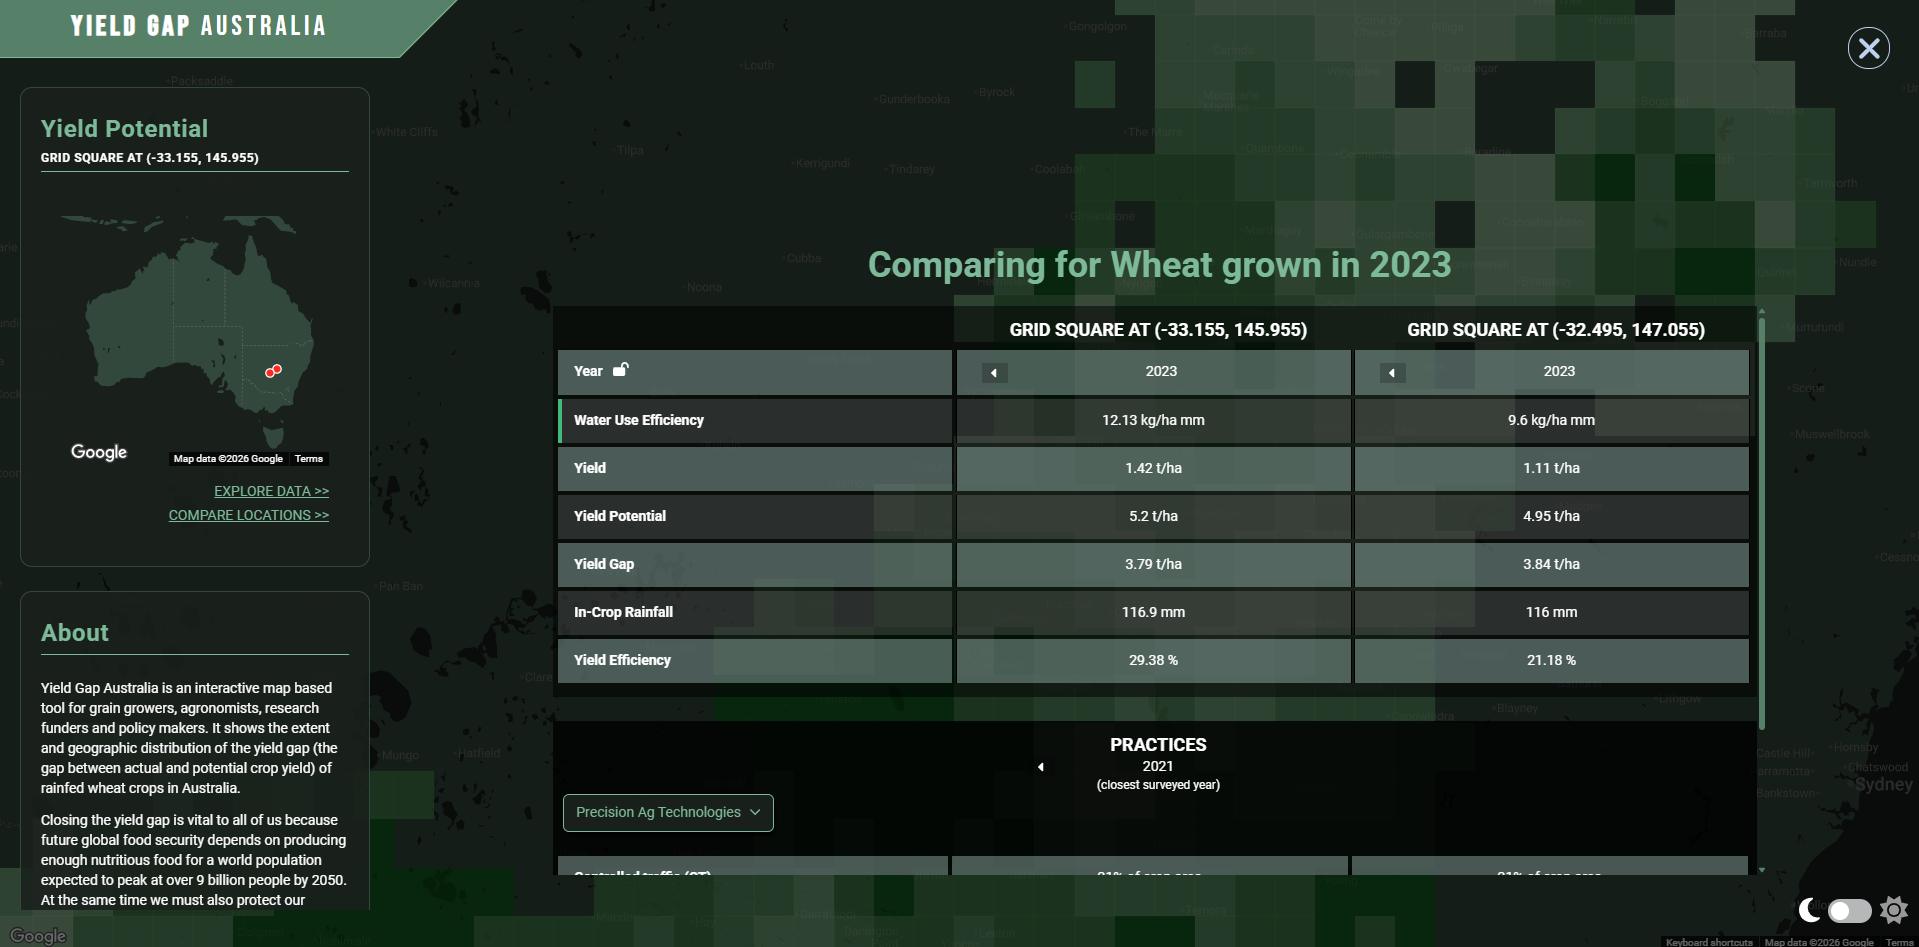
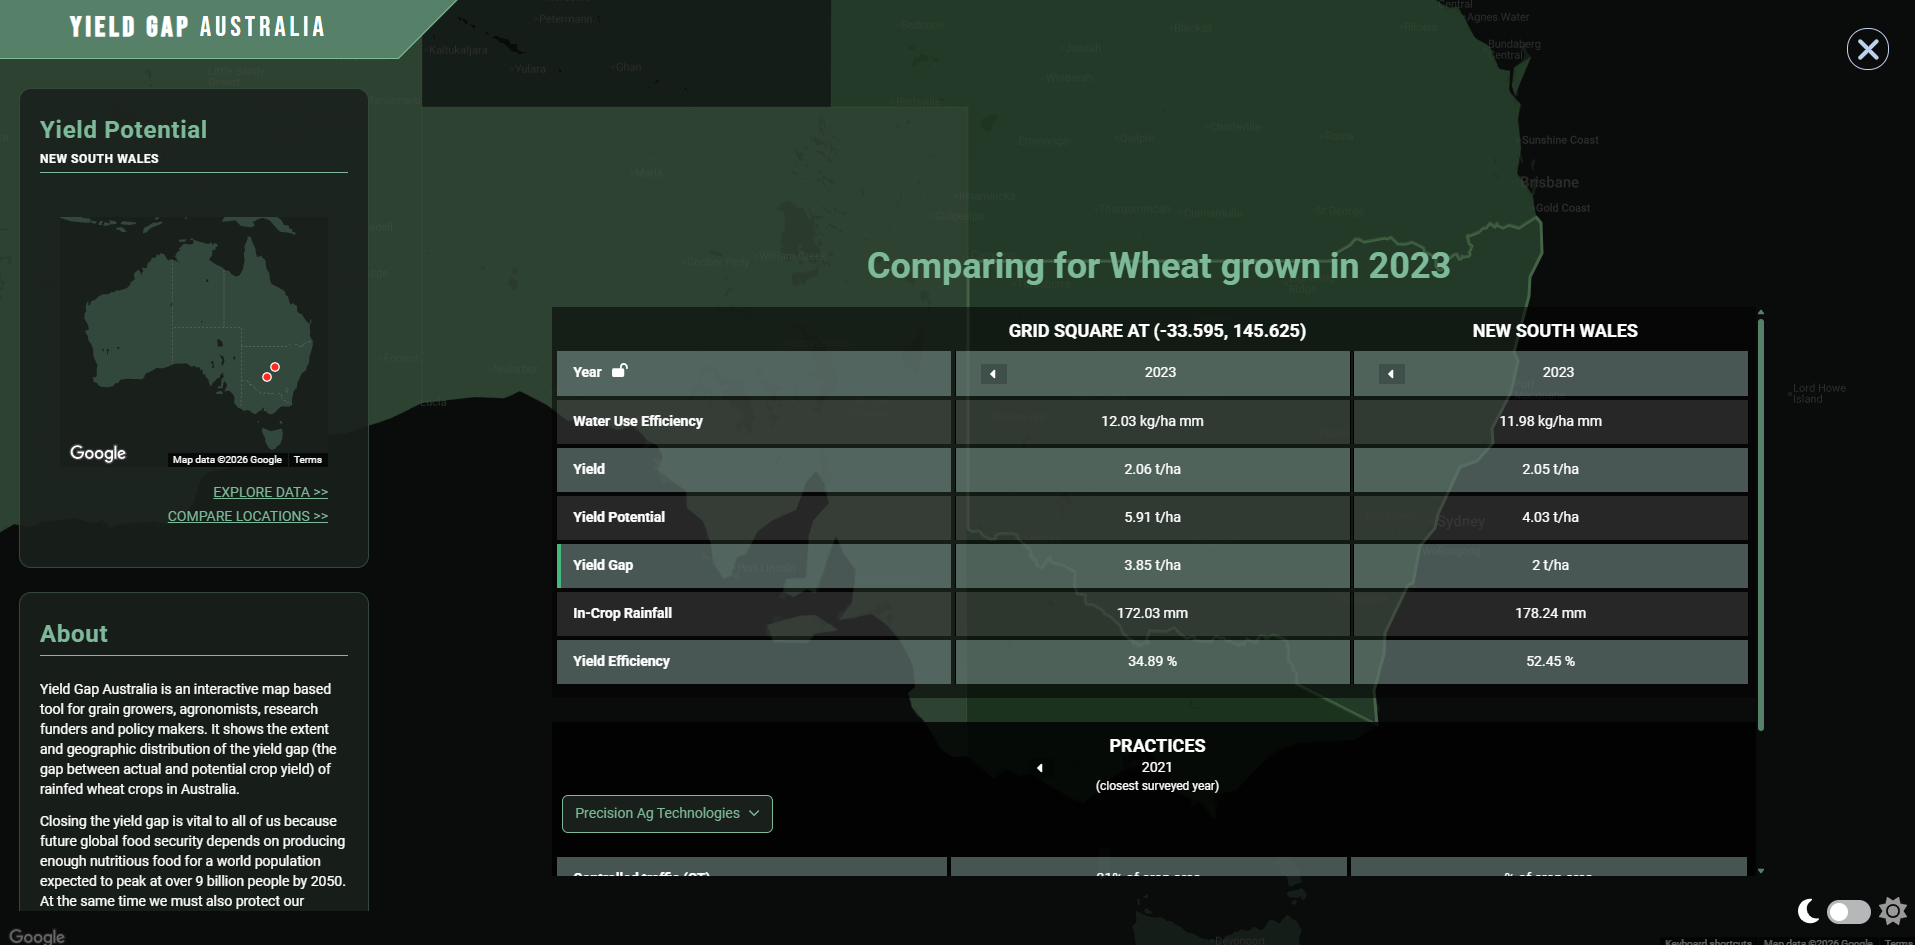
One of the cool new features we call "magic compare" (we're not great at naming things - see our company name!). This allows you to pick an attribute of a particular grid square like rainfall, and it will match your selected grid square with other squares that have the same rainfall and compare them on other factors like yield, yield gap and water-use efficiency along with practice behaviours. The intention behind this was to allow a grower to explore how other growers are doing with the same rainfall or yield, and whether looking into practice data could help explain some of the potential differences.
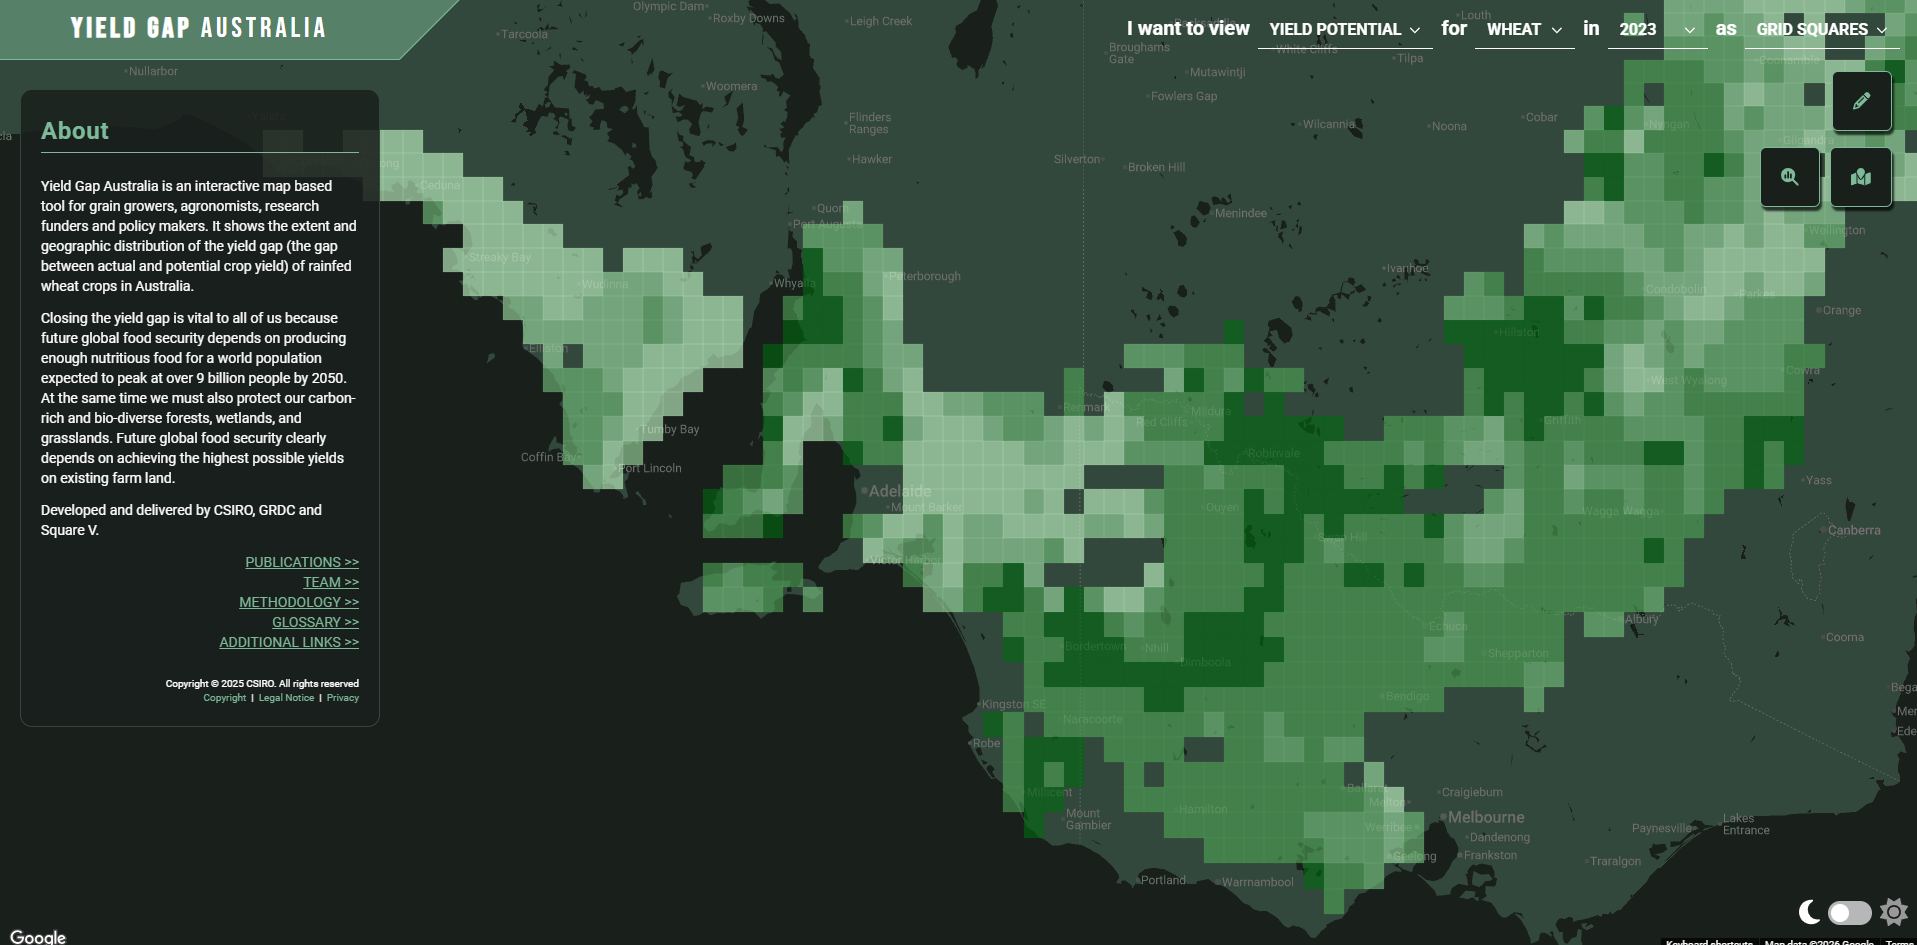
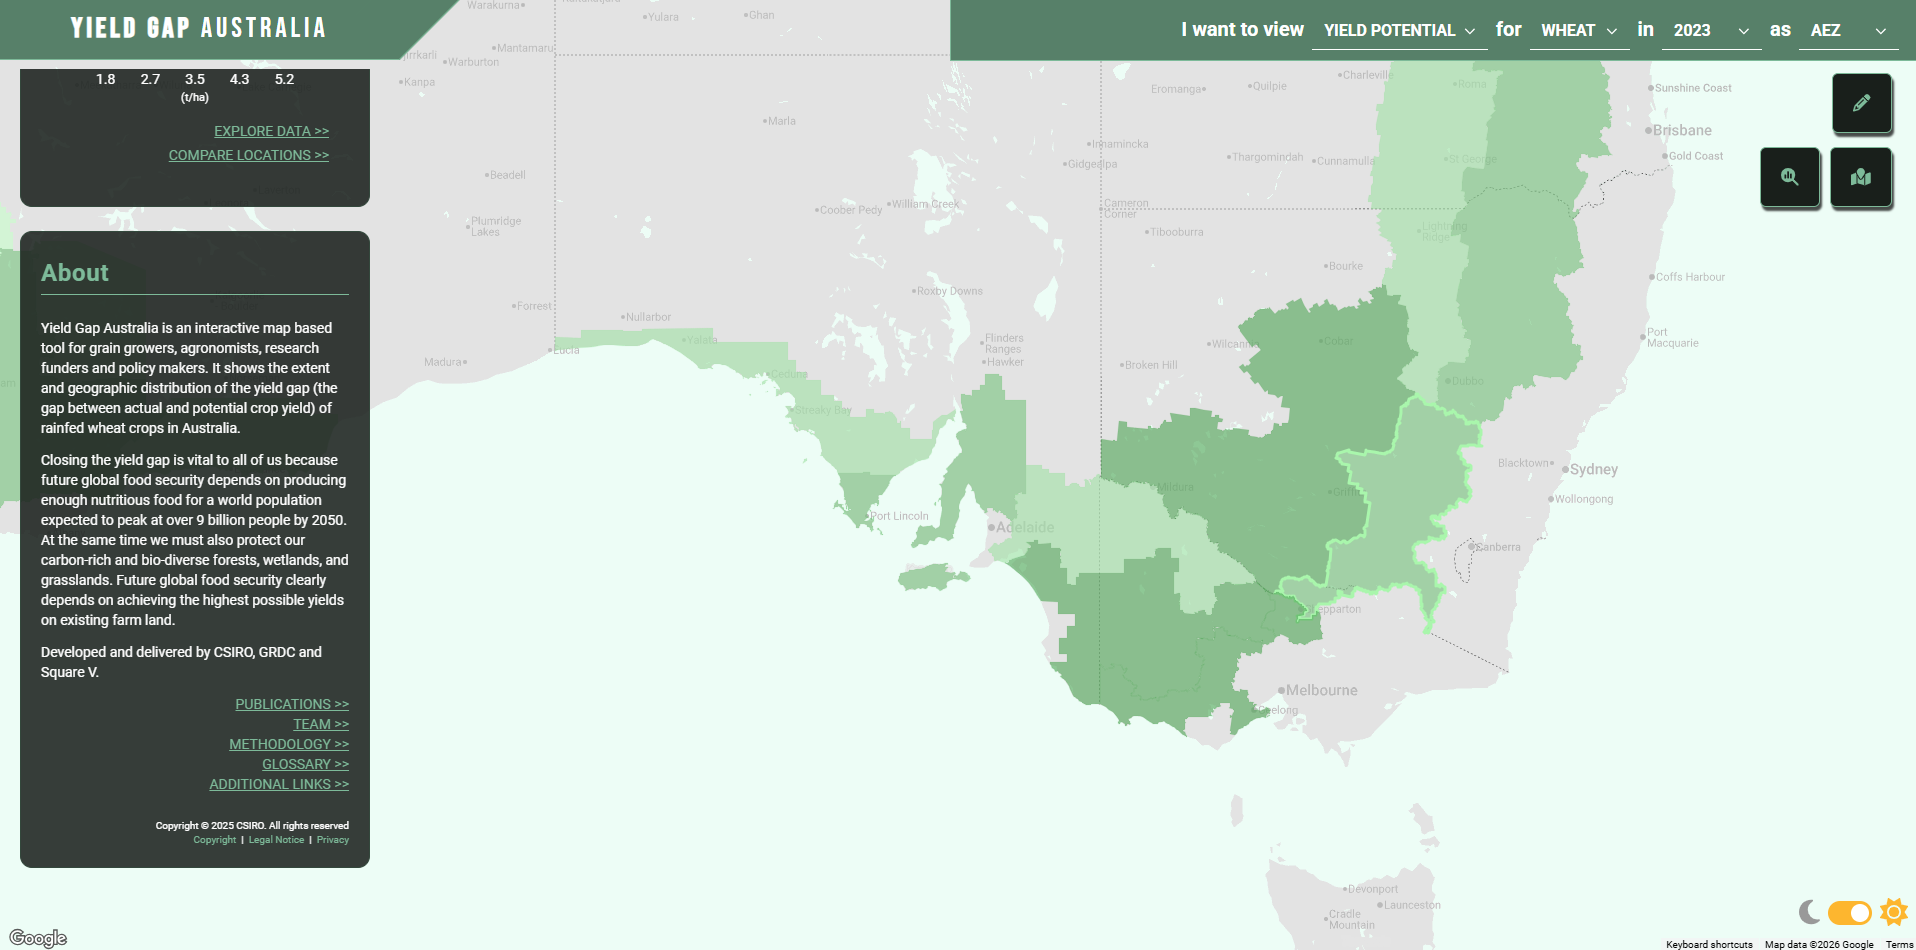
You can view the Yield Gap Australia v2 beta site here.